
Predicting the future: How much work is in our backlog?
In the final instalment of our four-part series, Dave Longman discusses how to use averages to estimate the undefined work in your backlog.

Welcome to the final instalment of our Predicting the Future series. In previous articles, we’ve discussed the basics of estimating and forecasting and covered some techniques to predict how long new work may take using historical data. In this article, I’m going to outline evidence-based forecasting, an approach that helps predict how much work is contained within an entire product backlog. (Warning: there is some maths involved once again, but it’s really just averages and counting.)
Before we dive into the evidence-based forecasting process, let’s look at a common method teams use to show how long their backlog will take: the burn chart. A burn chart shows both the total stories and the completed stories in the backlog. This chart forecasts when everything will be complete and, depending on how you draw it, can either ‘burn up’ until the completed work reaches the total outstanding work, or ‘burn down’ until there’s no more outstanding work to complete.
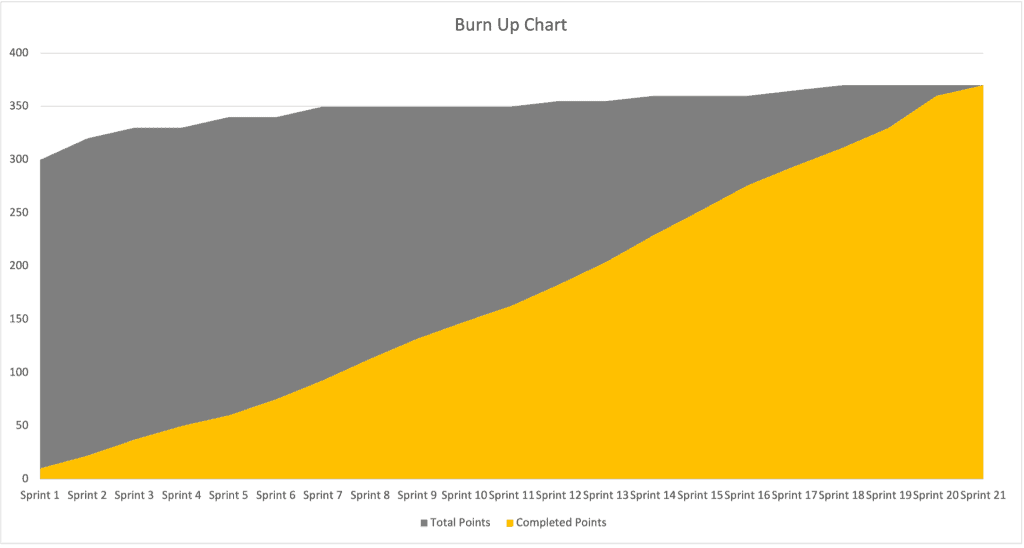
Burn charts are a really simple, visual way to clearly show stakeholders how the team is progressing. But I’ve never worked on a project where the backlog is anywhere near complete enough at the start of the project to be truly useful in forecasting – so it rarely looks this neat.
More often than not, the backlog grows in line with the team velocity, with a few bumps here and there as the team focuses on hitting a release date. So the charts usually look something more like this:
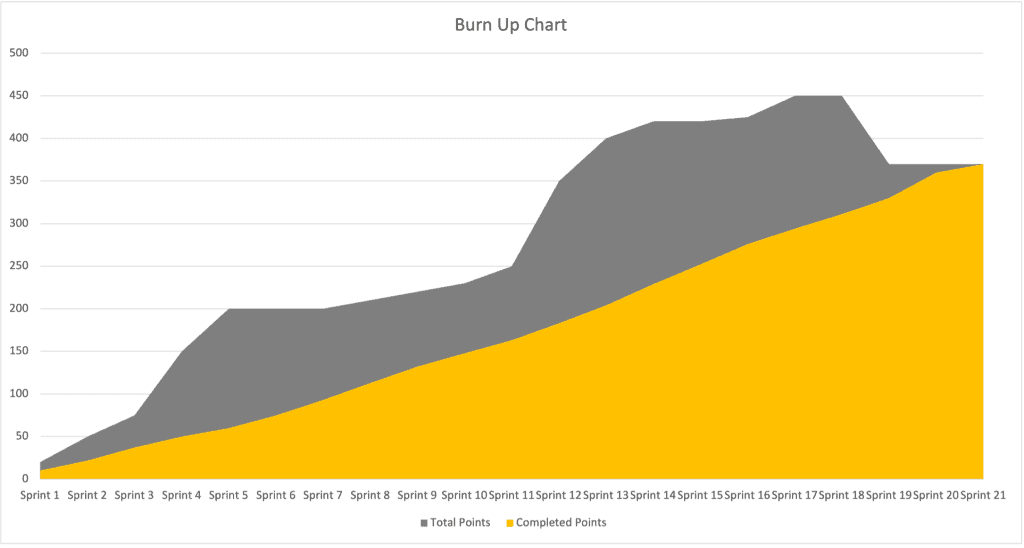
You can use evidence-based forecasting to quickly predict how big the backlog is likely to be without having to define all the stories up front, which enables you to draw a burn chart that looks more like the first example. We can do this quite easily with a bit of Excel work.
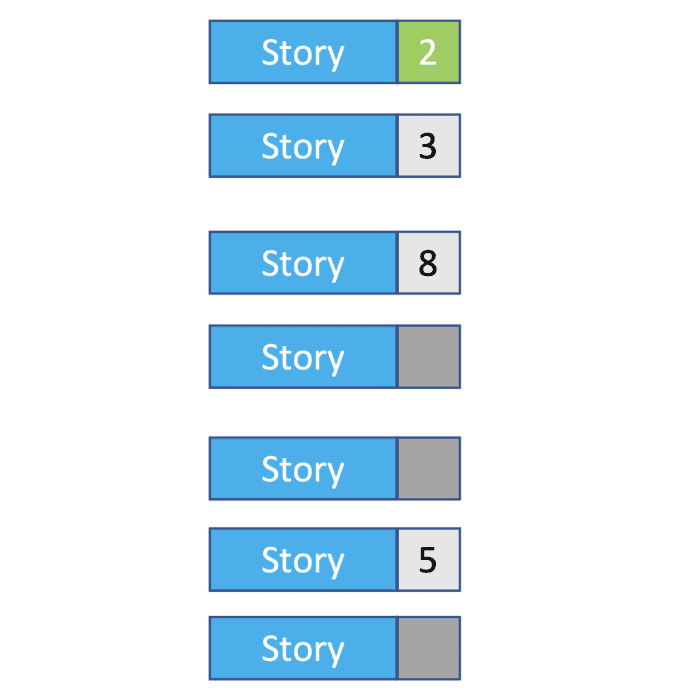
To explain, I’m using a really simple example backlog with seven stories. Four have estimates, one is completed, and three haven’t been estimated yet.
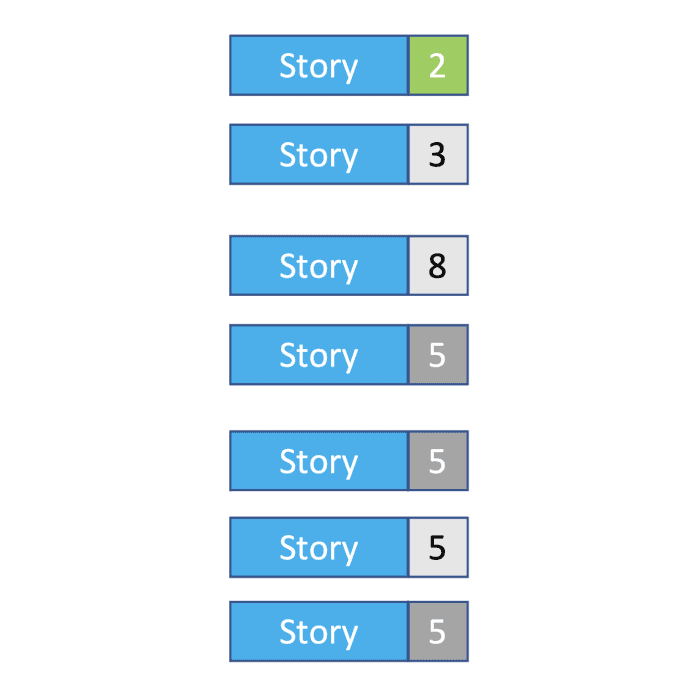
To form an idea of how big the three un-estimated stories are, we generally use the average story size of the backlog. In this case, there are four stories with estimates, totalling 18 points – so, on average, a story is five points. So, we update our backlog estimate to 33 points in total.
This gives you a slightly better understanding of your backlog. But for this to be properly useful, it’s better to work with a hierarchical backlog, as it’s much easier to think about what needs to be delivered over a long period of time without getting caught up in the details. I prefer using three levels: Epic > Feature > Story, but this concept works with any number of levels. I can now create a few epics as placeholders, then break each one down into features and stories as we get closer to delivering them.
Taking our example backlog, let’s look at it with the epics and features shown.
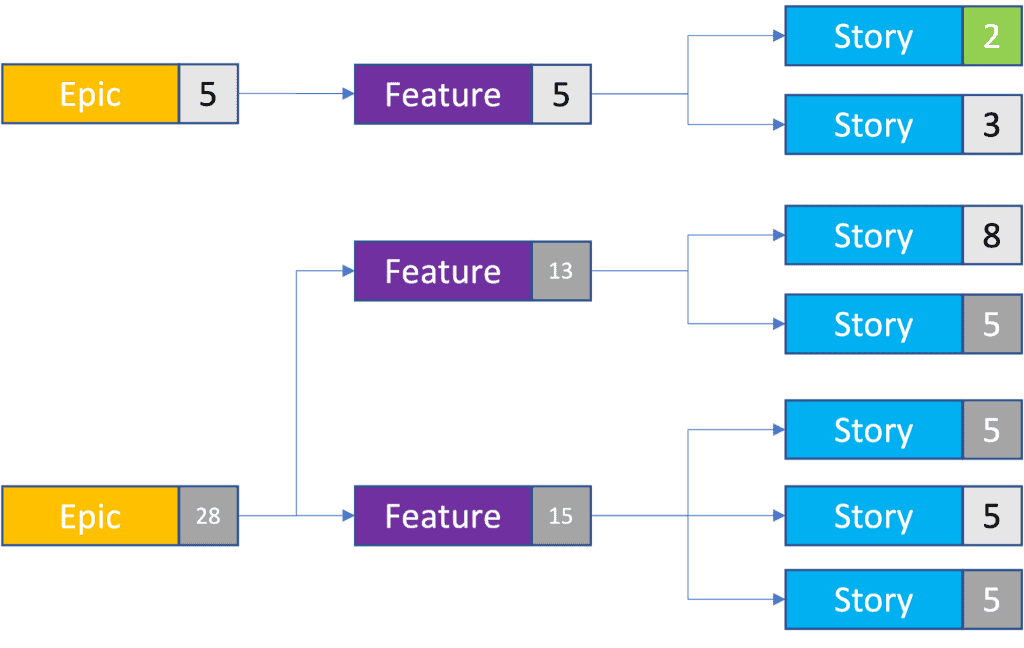
We now have two epics, made up of three features and the same seven stories. Using a combination of the real and forecast story points, we can calculate how big each epic and feature is. This means you can compare different epics within your backlog, which is often helpful if you need to prioritise quickly based on effort.
I really like organising backlogs like this because it helps highlight the big groups of functionality early, before I’ve had a chance to think about the detail. For example, if I need to create a web portal application, I know I’ll need a way to identify users, a web dashboard of some description, and probably an administration user interface. These become epics, and I can start thinking about the next level of detail. User Identification may break down into three features, one for Corporate Identities (Active Directory, Office 365, etc.), one for Social Identities (Facebook, Google, etc.) and one for assigning application functionality to specific users (authorisation). This method also lets me forecast the impact if there’s a feature missing from my backlog.
Continuing our example, let’s estimate the impact of a missed feature in the 28-point epic. How much work is that feature likely to be?
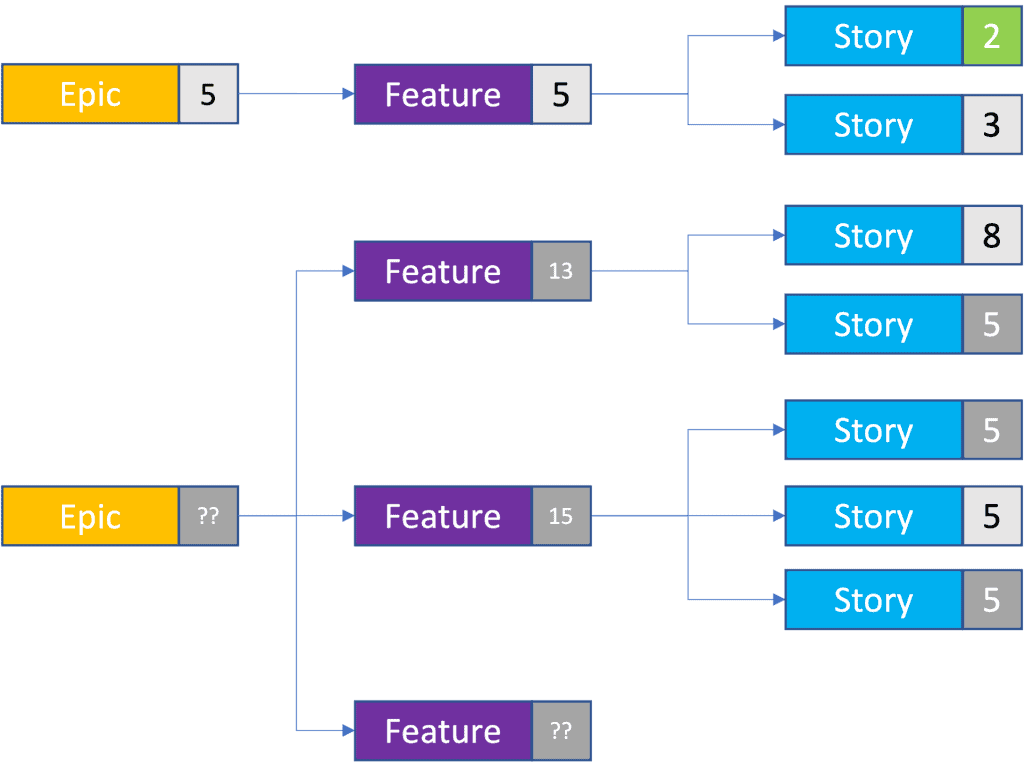
To calculate this, we can use the same process as we used for the un-estimated stories at the beginning. But instead of using story points, we use the number of stories as well as the average story size.
In the example, we have three features with stories, and a total of seven stories linked to those features. That’s an average of two stories per feature and, given that our average story size is five points, we can forecast that any feature in the backlog will be 10 points. So our total backlog size is now 43. And if the team uncovers a new functionality within the first epic, we can easily estimate this too.
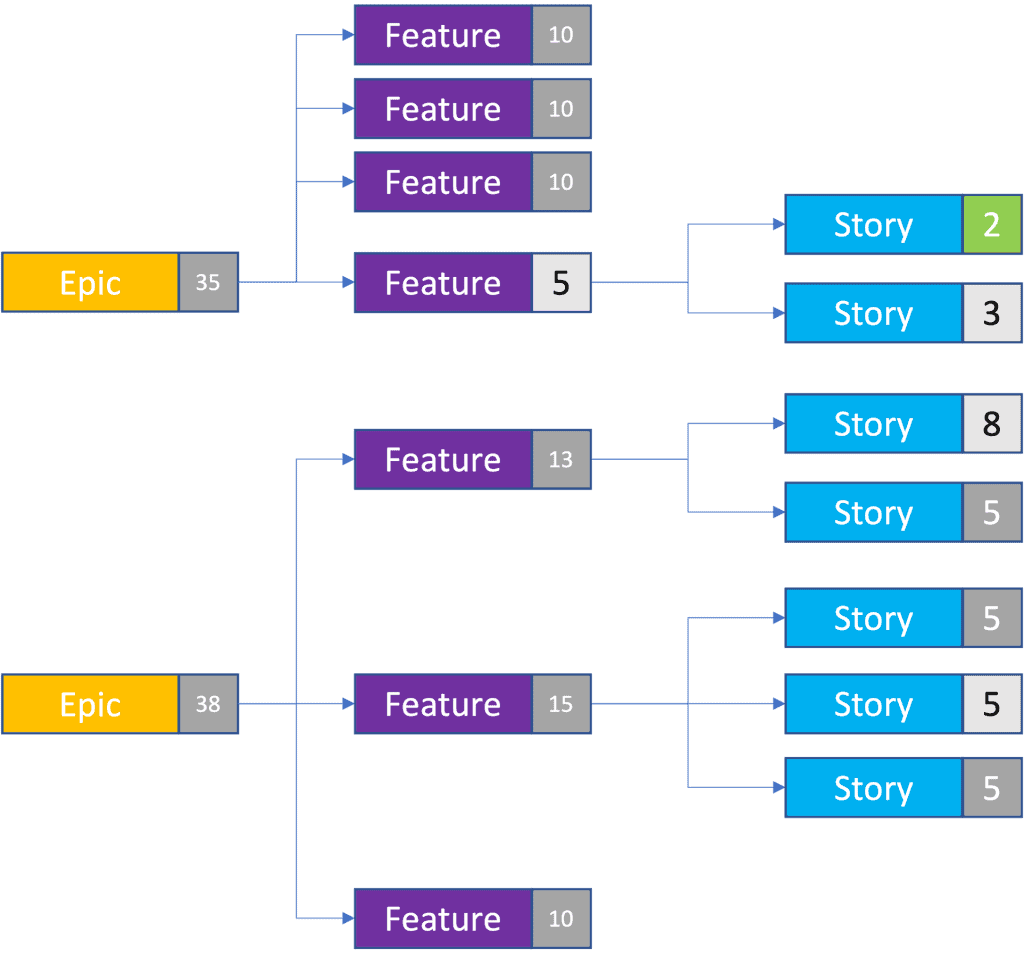
Using a similar approach, we can even predict the size of a completely new epic using the number of features per epic and the average feature size.
Now we can forecast that our total backlog is actually 118 points, even though we only have four stories with actual estimates. Of course, sometimes there’ll be features that are outliers, and are much larger or smaller than the average. But as the team continues to break down epics and estimate stories, the data we use gets more accurate, and size discrepancies will become less significant.
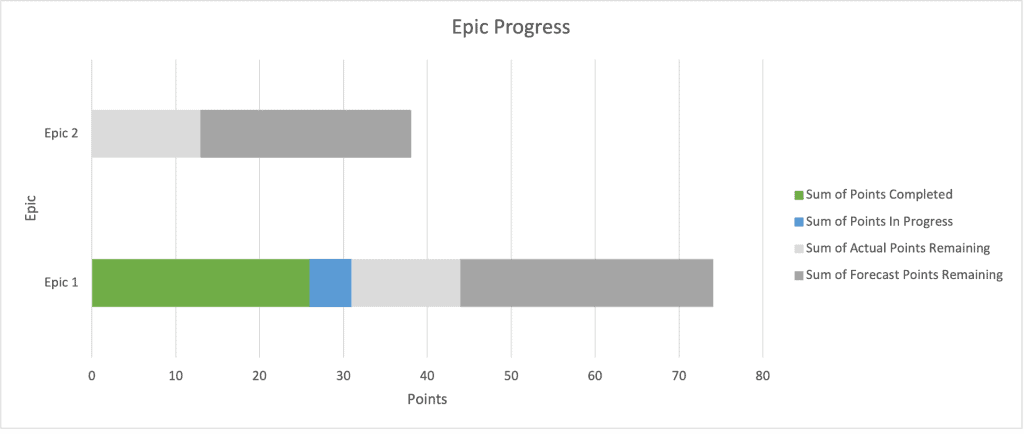
This process gives us a better way to estimate progress by including the work we’re expecting to do, as well as the work we don’t yet know about.
Here’s an example. If we plot the percentage completion of two epics and include the forecast points (in dark grey), we can see that Epic 1 is less than halfway complete. But without our forecast, we’d think it’s almost two thirds complete. We can also see that Epic 2 is probably bigger than the total work completed for Epic 1, so we can use that information to predict the time it will take to complete.
You can also use this information to make your burn chart more detailed and accurate. Take a look at this example:
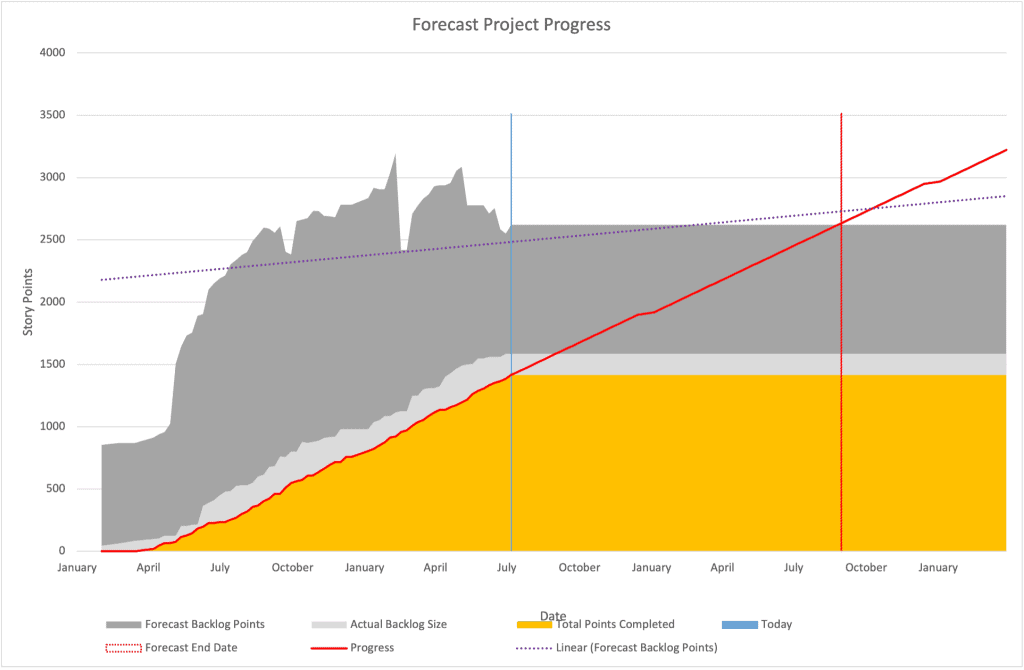
We can see that without the forecast backlog points (in dark grey), we’d only be showing the actual backlog size (in light grey) which would not be a good indicator of the total amount of work remaining. Including the forecast work gives a better indicator of when we might be done. If you keep track of this forecast completion date you can monitor it over time to see if you’re still within acceptable boundaries, like this:
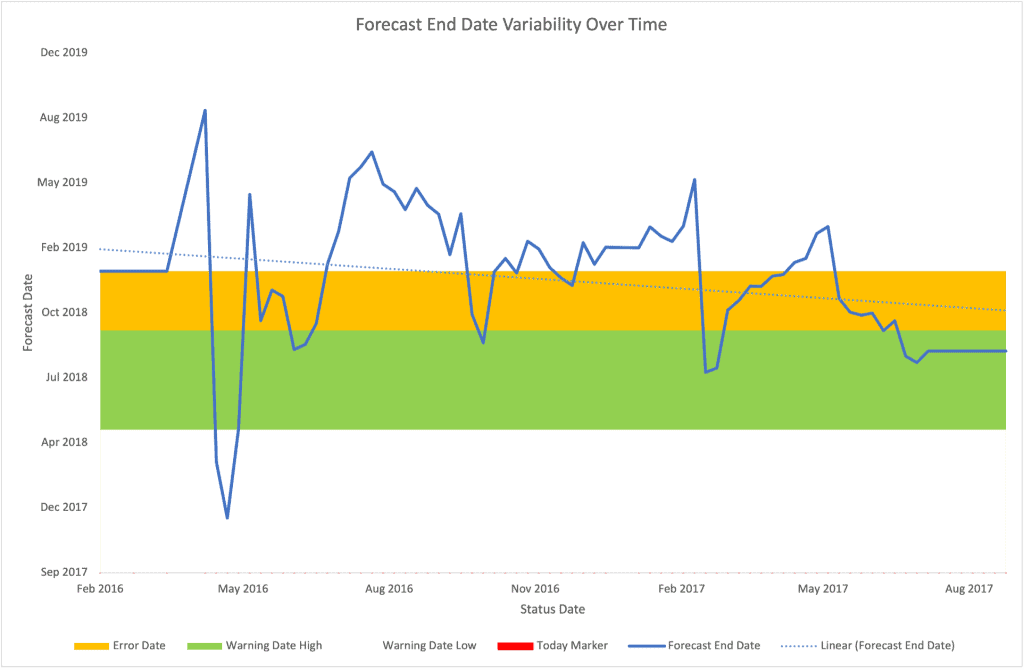
This allows the team to course correct part way through the work by changing the backlog content or priority, rather than waiting until the end when everyone is rushing to complete everything.
I started this series to give some examples of different ways to use your historical data to help teams forecast new work without spending a long time estimating.
We’ve covered a range of approaches, from using simple cycle time analysis to forecast time, to more complex Monte Carlo simulations to predict batches of work, and now using averages of existing information to predict entire backlogs. All of these approaches have their uses and none of them are perfect; they all give a different view of the future, and a combination of these approaches will give you a much clearer forecast. I really hope that you have found these articles interesting, and I would love to hear how you go about predicting the future in your own work.
This article is dedicated to Mike Collingsworth, a friend and former colleague, who was one of the first people to comment on this series. Rest in peace big man.
In the final instalment of our four-part series, Dave Longman discusses how to use averages to estimate the undefined work in your backlog.
Headforwards™ is a Registered Trade Mark of Headforwards Solutions Ltd.
Registered Address: FibreHub, Trevenson Lane, Pool, Redruth, Cornwall, TR15 3GF, UK
Registered in England and Wales: 07576641 | VAT Registration Number: GB111315770