David Longman

Client Delivery Lead

Dave has over 20 years experience working in the software industry across a number of different technical and leadership roles. He has been pivotal in several successful agile transformation initiatives and is a vocal advocate of delivering high quality and easy to maintain code. He has spoken at a number of industry conferences on team dynamics and estimating and forecasting.


Welcome to the third in our four-part series on estimating and forecasting. In this instalment, we’ll be looking at ways to forecast how long a project, feature, or group of stories might take using historical data and some simple mathematics. In the last article, we used cycle time to forecast how long a single story is likely to take the team. While this is a useful exercise and can be helpful for product owners when they’re reviewing the backlog, the more common question is: “Will we be able to complete this group of stories by this date?”. Or, more specifically, something like: “Can we complete the payment gateway upgrade before the holiday season?”. And that’s what we’re to attempt to answer in this article.

Get your tools ready

This is slightly more involved than the cycle time forecasting, and you’ll need to use a spreadsheet. You’ll also need to gather some historical information, not a lot though (and probably less than you’d expect). To make things easier for you, here’s a ready-made spreadsheet that you can download and just enter your data into. It’s also embedded below.

How to fill out the spreadsheet

Okay, so let’s first explain how to use the spreadsheet, and explore how it works.

The first things you need to provide are some examples of how much the team has previously completed. For this to work well, you need to have some consistency – so let’s presume your team and their iteration durations haven’t changed. Don’t panic if they have, just use the best data you have and be aware that the forecasting will be less accurate so redo it once you have some more consistent data. Simply enter the number of stories that the team previously completed each iteration into the table on the Historical Throughput tab. You can add up to 10 iterations’ worth of data, but four or five is enough for a decent forecast.

Second, you need to define the size of the work you want to forecast; this is all on the Will It Be Done By tab. Enter the total number of stories – this could be everything you have defined for a feature, for example.

I’ve never worked on a software project where the backlog contained absolutely everything that would be required; we’ve always discovered more work as we went along. The next two fields allow you to provide an indicator for how frequently new work is discovered for your team. There are two ways to identify ‘new work’: bugs in the system that need to be addressed, or additional stories either created by splitting existing stories into more deliverable sizes, or sometimes just things that were missed initially. In the spreadsheet, these are defined as ratios. For example, the team tends to create two new stories for every five stories. These values help forecast how large the backlog is likely to be at the end.

Finally, you need to define the iteration number you want all the work completed by and which iteration number you have just completed.

As you change the values in the spreadsheet, you’ll see that the prediction at the bottom of the page changes. There are four options: Definitely, Probably, Possibly and Unlikely, and these are based on the % confidence that all the expected stories will be completed in the time allowed.

Using simulations to build forecasts

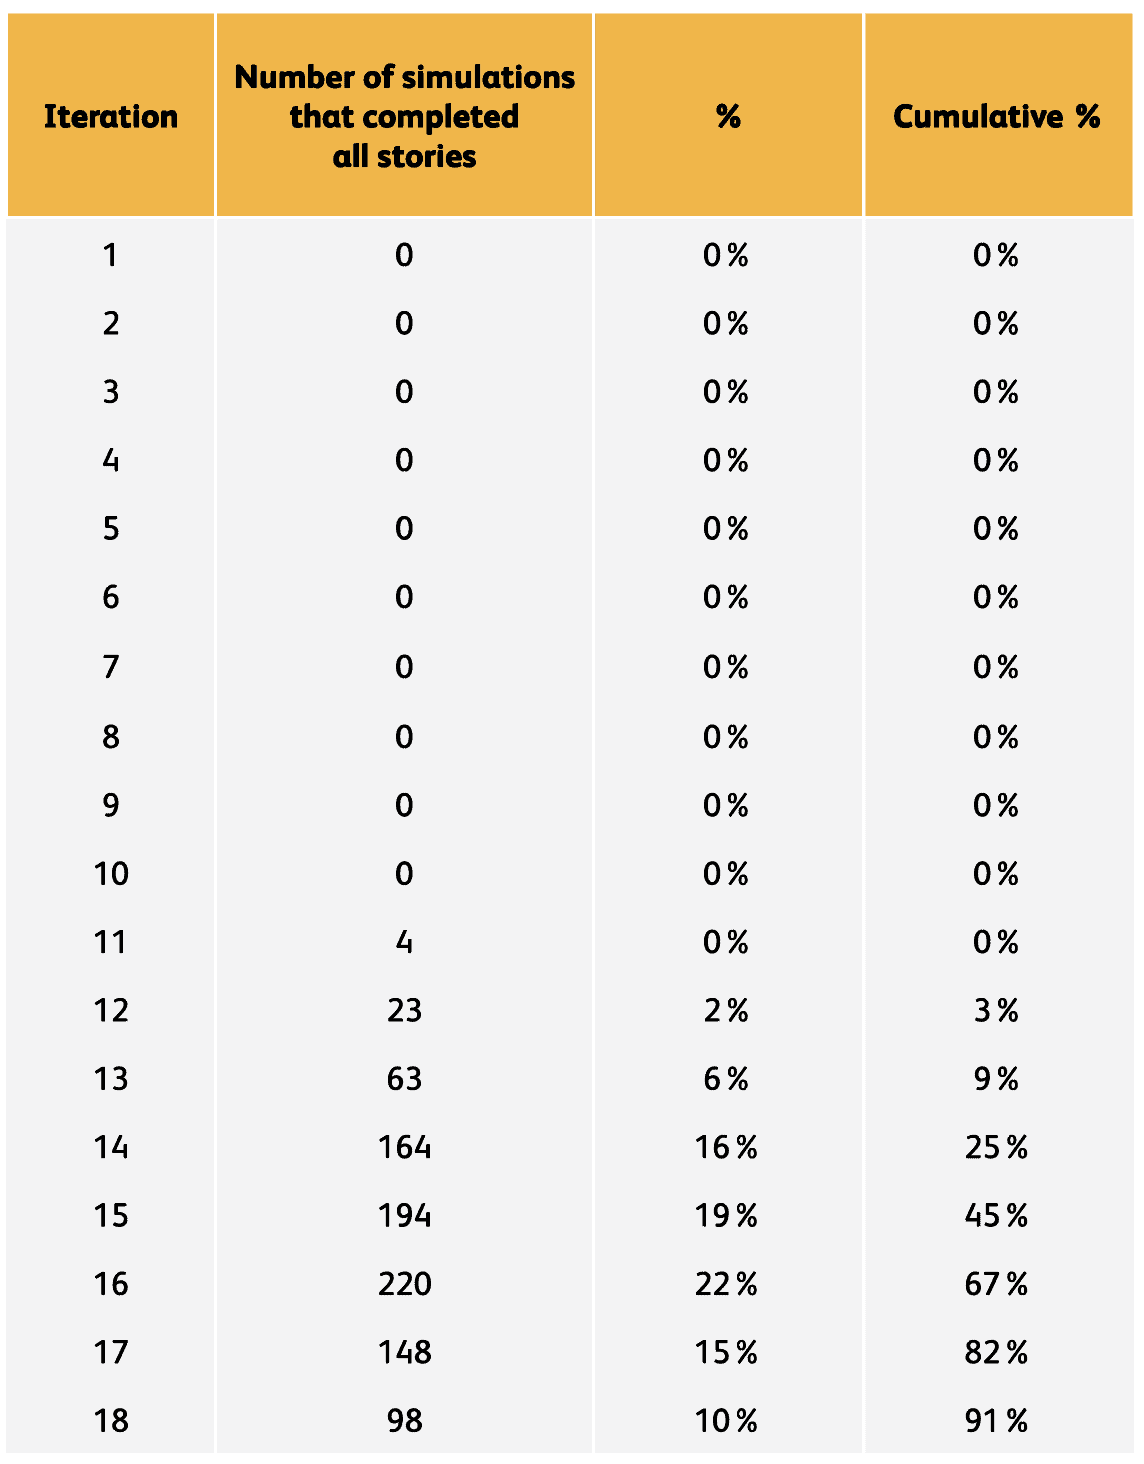
So, now you know how to use the spreadsheet, let’s explain how it works. It uses a Monte Carlo simulation, where we run simulations of the teams’ future iterations and analyse how many of them completed all the stories. We can then use this data to calculate a % confidence, in a very similar way to cycle time.

Sidenote: In the 1983 film WarGames, Matthew Broderick’s character uses the Monte Carlo simulation concept to ‘teach’ the supercomputer not to destroy the world in a nuclear attack by playing noughts and crosses against itself. I don’t recommend you use this spreadsheet for world destruction forecasting, but for software predictions I think it does the job quite nicely.

This spreadsheet uses the number of stories the team completed in their previous iterations as the probable range for the simulation. It then generates 1,000 virtual simulations of how many stories the team might complete over the next 30 iterations. Once this is complete, we can calculate how many iterations were required to complete the expected total number of stories. Then we can simply count how many iterations completed all the required stories and put that into a table like this:

So, that’s one way to forecast whether you will be able to complete a collection of stories by a certain date.

You can use a similar approach to answer other questions, like “how many stories can we complete by Christmas?”, or “how long will this project/feature take to complete?”. You can also take this further and keep a history of the forecasts to show how the delivery is progressing over time; this enables you to show whether the team are delivering as you originally forecast or whether you need to take some corrective action.

Further reading on forecasting

If you find this particularly interesting and you’d like to take it further, I recommend Team Guide to Metrics for Business Decisions by Mattia Battiston and Chris Young ­– it’s full of fantastic ways of thinking about forecasts. Another thought leader in the evidence-based forecasting arena is Troy Magennis; he has a number of useful articles and resources on his website, too.

In the next article, I’ll wrap up our Predicting the Future series by discussing a useful approach to forecasting how much work might be missing from your backlogs.

Headforwards™ is a Registered Trade Mark of Headforwards Solutions Ltd.
Registered Address: FibreHub, Trevenson Lane, Pool, Redruth, Cornwall, TR15 3GF, UK
Registered in England and Wales: 07576641 | VAT Registration Number: GB111515770