Predicting the future: how long will a story take?
David Longman
Head of Delivery
Dave has over 20 years experience working in the software industry across a number of different technical and leadership roles. He has been pivotal in several successful agile transformation initiatives and is a vocal advocate of delivering high quality and easy to maintain code. He has spoken at a number of industry conferences on team dynamics and estimating and forecasting.
Share:
In the second of a four-part series, Head of Delivery Dave Longman explores the best approach to forming an estimate. Read article one here.
Understanding how long a single story is likely to take is important when a team is planning work and valuable for product owners when they’re maintaining the product backlog and forming high-level release plans. But what’s the best approach to forming an estimate?
A lot of teams focus primarily on velocity when planning. They look at the average number of points they complete within an iteration and use this to indicate how many they’re likely to finish in the next one. This is a good approach if you need a quick estimate for how much work to include in an iteration, but it relies on all work having its own story point estimate.
I’m more interested in how we can answer the question of ‘how long will this story take?’ without going through the process of estimating the effort at all.
Velocity vs lead vs cycle: understanding the measures
When you’re predicting how long work will take – without focusing on the effort involved – lead times and cycle times become your best friends. These measures are closely related to velocity, but they provide more granularity, which is useful for forecasting.
Let’s start with some definitions, so we’re all on the same page:
Velocity As I mentioned above, this is a measure of the number of stories or story points are completed in each iteration, which helps estimate how many points a team is likely to complete in the future. For example, if the team generally completes 30 points each sprint, it’s unlikely that they’ll complete significantly more or less in the next one, all other things being equal. Velocity doesn’t care how long the work takes; it focuses solely on how much was completed.
Cycle Time This measures the time (usually in days) between when the development team starts work on the story and when it’s completed. Cycle time doesn’t factor in how much effort the story was or why the work might have taken longer than usual, and it doesn’t attempt to quantify how good the team is at predicting how much work it can complete. Because it focuses on elapsed time rather than effort, it’s a helpful metric for teams to review over time. Generally, high-performing teams will have lower cycle times.
Lead Time This is a measure of the time elapsed (usually this is in weeks) from story creation to delivery. It’s a superset of cycle time which shows how long it takes for a new idea to be delivered. A long lead time can indicate that the product backlog is being defined too early, which risks work being out of date by the time the team starts looking at it. There’s a balance between defining work too early and leaving the definition too late, which makes it very hard to forecast a larger programme of work. (We’ll revisit this idea later in the article series.)
Cycle time gives the most accurate estimates
To understand how long a story is likely to take, we’re most interested in the cycle time. Looking at lead time is misleading because this includes the delay for prioritisation. If it’s low priority, a story that takes just one day to code, test, and release may have a lead time of many months. And when people ask how long a piece of work will take, they’re usually assuming that it will be prioritised.
While we could simply calculate an average cycle time measure as we do with velocity, it’s more useful if we calculate the frequency distribution instead. This allows us to identify the cycle time in which 80% of a team’s stories were completed.
For this, I like to use the modified Fibonacci sequence to categorise the cycle times. That way, we increase the range as the duration gets larger, which gives us some wiggle room. (These sequences will also be very familiar to anyone who has estimated effort using planning poker.)
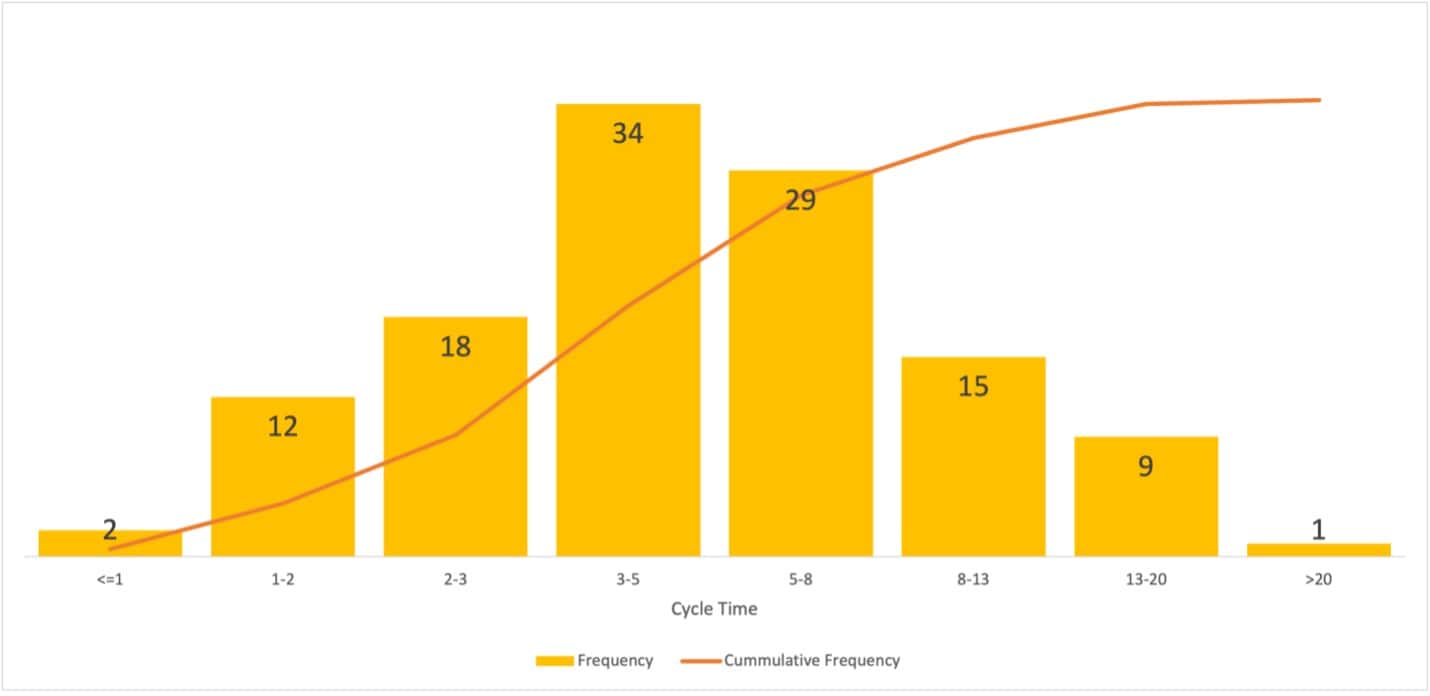
When we calculate the distribution, we can create a chart like this:
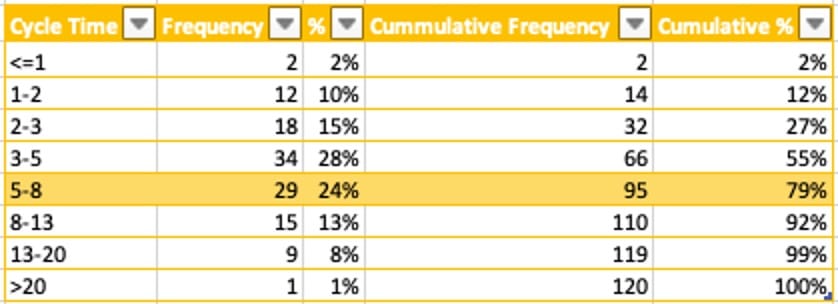
This chart is interesting in its own right. It shows that this data is very normally distributed, and most stories are completed within three to five days. This may be enough information by itself, but it’s often helpful to also show the data as a table, so the cumulative percentage or percentage confidence is more visible.
In this example, the team completes 79% of its stories in less than eight days and 92% in less than 13 days.
Talking about percentage confidence with the product owner is helpful as it helps us understand how much uncertainty is acceptable. If the story was something with a hard deadline – to comply with a regulation, for example – you may want to plan using a higher confidence level. In the example above, you’d use the <13 days forecast because the team completes 92% of its stories within this range.
If the work’s deadline is more flexible, you may decide to forecast using the <5 day range, because most of the team’s historical work has been completed within three to five days. However, 45% of stories still take more than five days, so there’s a good chance that the forecast will be wrong.
Deciding which range to use all depends on how comfortable everyone will be if the forecast turns out to be wrong.
Expanding your forecast
Using the cycle time like this is helpful when looking at small numbers of stories and particularly useful working with product owners to maintain their backlog.
However, I often find that clients don’t want a timeline for one or two stories. More often, they ask me how long a larger group of stories or an entire project is likely to take. In these situations, I tend to take a slightly different approach to create a forecast – and that’s what we’ll explore in the next article.
In the first of a four-part series, Account Director Dave Longman explores whether estimates are a useful tool – and how to forecast project progress effectively.
Headforwards™ is a Registered Trade Mark of Headforwards Solutions Ltd. Registered Address: FibreHub, Trevenson Lane, Pool, Redruth, Cornwall, TR15 3GF, UK Registered in England and Wales: 07576641 | VAT Registration Number: GB111315770